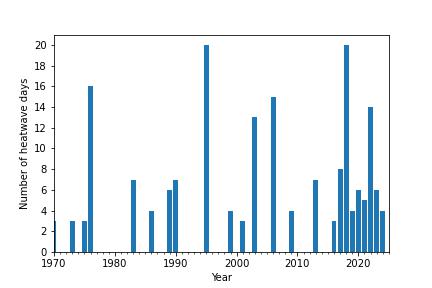
Heatwaves in Reading

Definition of a heatwave

In Reading and the surrounding area, the official definition of a heatwave is a spell of three days or more, each of which has a maximum temperature of 28 °C or above.

Occurrences since 1970

The University's weather station was moved to its current location in January 1970. Between 1970 and 2023 heatwaves have occurred on 37 occasions between June and September.

Month:JuneJulyAugustSeptemberTotal
No. of heatwaves that began in the month:719101 (in 2023)37
No. of heatwave days in the month:2693596184
Highest temperature each month in a heatwave: 34.0 °C (June 1976) 37.6 °C (July 2022) 36.4 °C (August 2003) 31.4 °C (September 2023)

Some statistics:

Earliest day forming part of a heatwave:
9 June 1970
Latest day that was part of a heatwave:
9 September 2023
Most heatwave days in a year:
20 (in both 1995 and 2018)
Longest heatwave: 16 days
23 June - 8 July 1976
Most heatwaves in a year:
4 (in both 1995 and 2018)
Fewest heatwaves in a year
0 (in each of 1971-1972, 1974, 1977-1982, 1984-1985, 1987-1988, 1991-1994, 1996-1998, 2000, 2002, 2004-2005, 2010-2012 and 2014-2015)
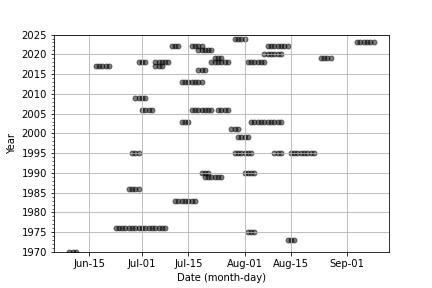
Both graphs updated to 10 August 2024

Each year in the 8-year period 2016-2023 experienced a heatwave; previously heatwaves had never occurred in more than two consecutive years, namely 1975-1976 and in 1989-1990.

In the 54-year period 1970-2023 heatwaves occurred in 23 of the years, 13 of them since 2000. The period 2001-2023 saw 111 of the 184 heatwave days recorded since 1970.

Postscript: 2024 has also reported heatwave days in Reading.

Warm air in the atmosphere can hold more water vapour than cold air. So it is possible that increasing the number of hot days each year - and, indeed, the average temperature of the air in Reading in general - might lead to an increase in the number of days with large falls of rain. Note that the rainfall amounts recorded before and after the site relocation in 1970 show almost no change due to the site change.

One way to check this possibility is to examine the wettest days in Reading, year after year, as follows.

  • The 5 percent wettest days in the entire period 1961-1990 were determined.
  • This amounted to a total of 548 days over the 30 years - or about 18 days each year on average.
  • The precipitation falling on these wet days totalled 9.1 mm or more.
  • Then, the number of days each year receiving 9.1 mm or more precipitation was determined and is plotted in the graph, along with the 10-year running mean of the number of such wet days.

  • While there is a lot of variation from year to year, there is a suggestion that the number of years when the number of wet days totalled 20 days or more has become more prevalent since about 2000, while the 10-year running mean has shown an increase in values from around 1981-1990 to 2014-2023.

However, if we examine the amount of rain falling on the wettest day of each year since 1961, then it is difficult to see any similar trends.