Here's a two-dimensional version of our foyer display...

The changing climate of Reading - as shown by the new 1991-2020 climatology

Introduction

31 December 2020 marked the end of another year, another decade and (most importantly for meteorologists)
the end of a 30-year period that will be used for calculating new worldwide 30-year averages.

According to the World Meteorological Organization, it will introduce a new a two-tier approach to
the 30-year baselines for climate data consider the rapid pace of climate change as well
as the operational needs for up to date climate information.

Because the climate varies naturally from year to year, climatologists use standard 30-year
averages of temperatures, precipitation and other variables to put, for example, the magnitude of
a current heatwave or rainstorm into historical context. These 30-year historical averages are called
climate normals and can be calculated at the local, national or global levels.

Climate normals are presently updated once every 30 years, and the current [as of late 2020] official
climate normal period is 1961-1990. Thus the 30-year climate normal to be used in the 2020s will be
1991-2020. But the 1961-1990 baseline for assessing climate change will be kept until there is a
scientifically compelling reason for changing it [WMO].

The second part of this two-tier approach is to update the climatological Standard Normals
for operational purposes every 10 years - as rising atmospheric concentrations of greenhouse gases
are changing the Earth's climate much faster than before. As a result, decision-makers in
climate-sensitive sectors and industries such as water management, energy, agriculture and
viticulture may be basing important decisions on information that may be out of date.

At the University of Reading climatological station we have observations for the current site at
Whiteknights going back to 1968 - so this study will look the 30-year periods of 1971-2000, 1981-2010
and 1991-2020 to examine how the climate of Reading has changed in the past 50 years.

This preliminary study will examine changes in the climate of Reading as revealed by
observations or air, surface and soil temperatures, rainfall, sunshine and the incidence of thunder,
fog and snow.

1991-2020 climatology of Reading

Month Average daily maximum temperature (°C) Average daily minimum temperature (°C) Average daily temperature (°C) Average 30 cm earth temperature at 0900 UTC (°C) Average 100 cm earth temperature at 0900 UTC (°C) Average number of days with snow/sleet falling Average number of days with over 50 % snow cover at 0900 UTC Average number of days with thunder heard Average number of days with fog (visibility under 1 km) at 0900 UTC
Jan 8.0 2.1 5.1 5.6 7.2 2.31.00.32.0
Feb 8.6 2.1 5.4 5.6 6.7 3.11.50.22.1
Mar 11.23.5 7.4 7.2 7.5 1.80.40.41.4
Apr 14.25.1 9.7 9.8 9.3 0.70 1.00.2
May 17.47.9 12.712.911.70 0 1.10.2
June20.410.815.615.914.10 0 1.20.1
July22.712.917.817.816.00 0 1.40.1
Aug 22.312.717.517.816.80 0 1.60
Sept19.310.414.915.715.80 0 0.60.8
Oct 15.17.9 11.512.713.90.10 0.71.4
Nov 11.04.7 7.9 9.4 11.30.30 0.32.4
Dec 8.4 2.5 5.5 6.7 8.7 1.51.20.22.3
1991-2020 Year14.96.9 10.911.511.69.94.29.012.9
1981-2010 Year 14.5 6.7 10.6 11.1 11.3 10.9 5.9 9.0 13.8

Month Average monthly precipitation total (mm) Average number of rain days with 0.2 mm or more rainfall Average number of wet days with 1.0 mm or more rainfall Average number of days with air frost Average number of days with ground frost Average number of days with temperature remaining below 0 °C Average number of days with temperature rising to 30 °C Average number of days with minimum temperature remaining above 15 °C Average sunshine duration (h)
Jan 64.5 16.4 11.7 9.0 19.8 0.40 0 55.0
Feb 45.0 13.3 9.7 8.0 17.6 0.20 0 78.3
Mar 40.3 12.2 8.5 4.7 17.1 0 0 0 118.6
Apr 48.6 12.5 9.3 1.9 14.5 0 0 0 169.6
May 43.5 11.6 8.1 0.2 8.1 0 0 0.1198.6
June46.9 11.0 7.6 0 2.2 0 0.41.4195.4
July48.7 11.5 8.1 0 0.4 0 1.36.0203.8
Aug 56.8 12.1 8.4 0 0.7 0 0.96.3192.4
Sept49.6 11.4 8.2 0 3.8 0 0 1.7143.3
Oct 73.7 14.1 10.7 0.9 8.2 0 0 0.3107.8
Nov 72.3 15.8 11.7 3.9 13.9 0 0 0 59.3
Dec 64.8 15.7 11.2 9.2 18.4 0.30 0 45.3
1991-2020 Year654.7157.4113.337.8124.51.02.615.81567.4
1981-2010 Year 634.4 153.8 111.2 40.9 123.5 2.0 2.0 14.4 1522.1

Note that all numbers are rounded up/down, so there may be an apparent discrepancy in the annual totals.

How has the climate changed in Reading?

We are all aware of the trend towards rising temperatures across the globe, but how much has the temperature changed in Reading since 1970?

Air temperature

Figure 1 shows that, over the year as a whole, the air temperature rose by about 0.3 degC between 1981-2010 compared to 1971-2000, and by about 0.6 degC between 1991-2020 compared to 1971-2000. The change is slightly larger in late spring/early summer, but quite different in December and April. Why these differences?

  • Of the seven warmest years in Reading, six have occurred since 2003 and four since 2010; these seven are (in order of coldest to warmest) 1990 and 2003 (11.4 °C), 2011 and 2018 (11.5 °C), 2014 and 2020 (11.6 °C), and 2006 (11.8 °C).
  • April's temperatures in east Berkshire have, indeed, seen sudden changes. From the mid-1960s to the late-1980s average temperatures each year remained below the 1981-2010 average, while since 2002 very few Aprils have been colder than that average. In fact, three years in that latter period were more than 2 degC warmer than average (2007, 2011 and 2020) with the former two being over 3 degC warmer than average.
  • While in the very mild December of 2015 temperatures averaged above 5 degC above normal locally, warm and cold Decembers tended to balance each other out in east Berkshire until about 2011 (following the cold Decembers of 2008 to 2010 which had 'dragged down' the 30-year average temperature). As a result, average temperatures during the month changed little between 1990 and 2010.

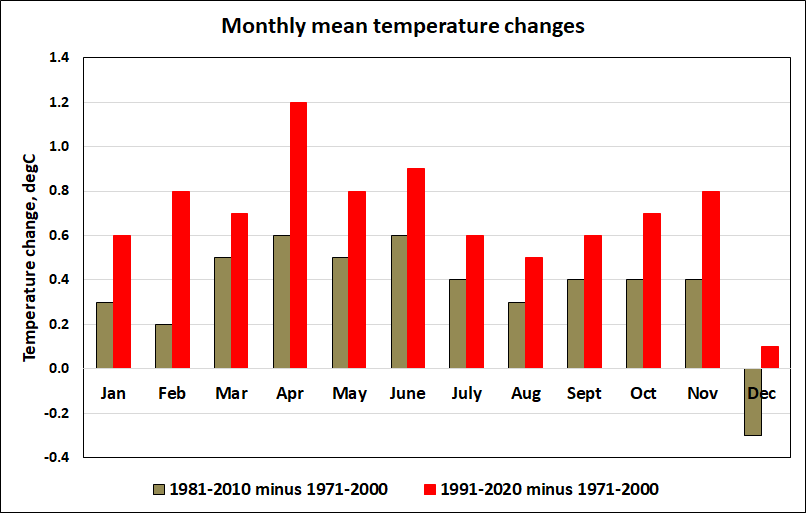
Figure 1. Mean temperature changes each month between 1971-2000, 1981-2010 and 1991-2020. A positive number indicates a warming in recent years.

Night frosts

The incidence of air frost has decreased slightly from 1971-2000 to 1991-2020, with just under 38 days per annum expected now, compared to 41 previously. December is now the frostiest month with an expectation of 9.2 days with air frost in 1991-2020, compared to January in 1971-2000 when 9.6 days with an air frost were expected each year on average.

Between 1971-2000 and 1991-2020 the number of days with ground frost (as measured using a thermometer located at grass-tip level) expected each year has declined slightly from about 128 days to 124 days.

During 1971-2000 the coldest night each year averaged out with a minimum temperature of -7.1 °C; during the period 1991-2020 this had risen to -6.3 °C.

A temperature of -8 °C was recorded in 10 out of the 30 years of 1971-2000; during 1991-2020 this count had declined to just 4 years. So cold nights seem to becoming less frequent.

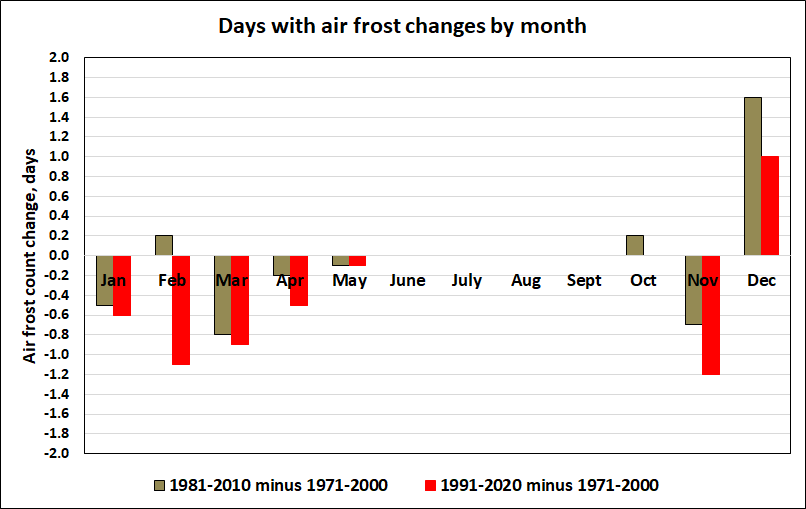
Figure 2. Changes in air frost incidence each month between 1971-2000, 1981-2010 and 1991-2020. A negative number indicates a decrease in the likelihood of air frost.

Hot days

During 1971-2000 the highest air temperature each year averaged out at 29.5 °C - during the period 1991-2020 this had risen to 30.9 °C.

During 1971-2000 30 °C was reached in 11 out of the 30 years; during 1991-2020 this rose to 18 years, including each year from 2015 to 2020 inclusive. During 1971-2000 an average of 1.7 days each year reached 30 °C (note that 1976 contributed 0.6 days to this total) while during 1991-2020 the average rose to 2.6 days per annum.

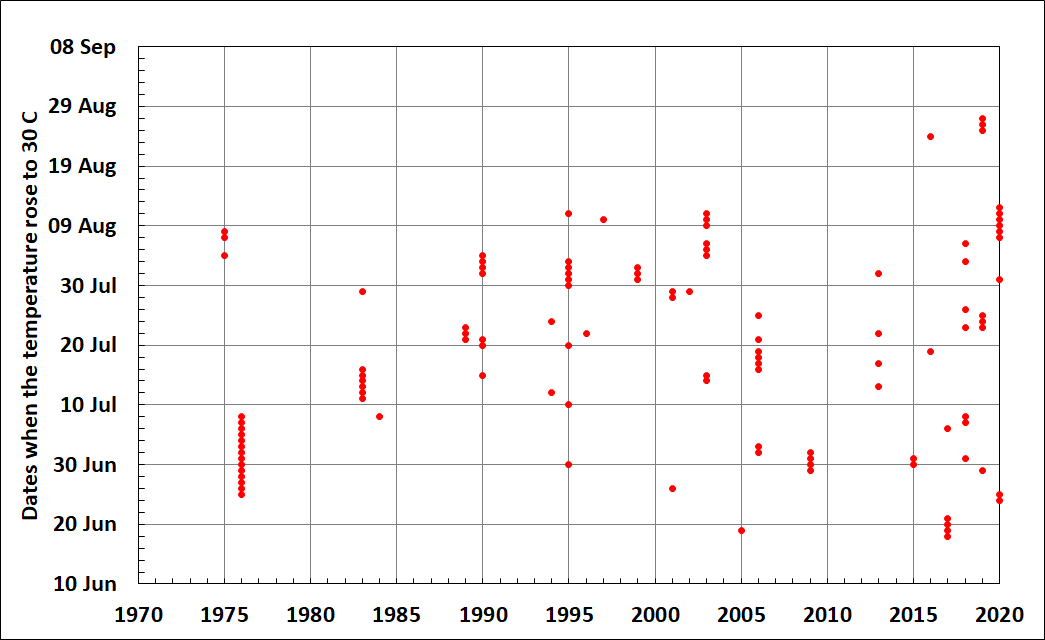
Figure 3. Dates when the air temperature reached 30C each year, 1971-2020.

Precipitation

The expected precipitation totals each year in Reading have changed from an average of 629.7 mm during 1971-2000, to 634.4 mm during 1981-2010 and then to 654.7 mm in the period 1991-2020. This amounts to a 4 per cent increase across these periods.

  • Of the 12 wettest years in University of Reading records since 1901, four have occurred since 2000, namely (in order of increasing rainfall) in 2002, 2012, 2000 and 2014 (when 876.6 mm fell). The wettest year remains 1903 with 961.4 mm.
  • This increased precipitation resulted in an additional 2 % in the rain day incidence (days with 0.2 mm or more), an extra 3 % wet days (days with 1 mm or more) and 3 % very wet days (days with 5 mm or more) between 1971-2000 and 1991-2020.
  • Spring (March-May) has become slightly drier, but the other seasons wetter between 1971-2000 and 1991-2020 - autumn (September-November) by about 15 mm from 181 mm to 196 mm.

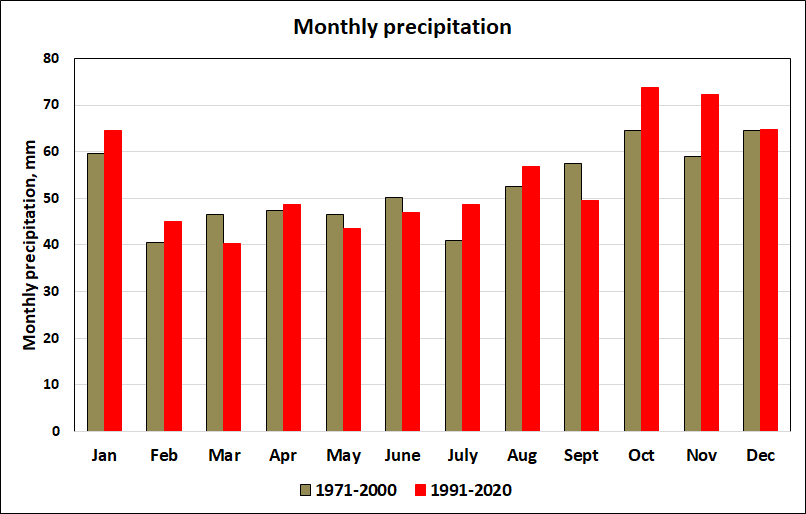
Figure 4. Precipitation changes by month, 1971-2000 to 1991-2020.

Wet days

A warm atmosphere can hold more water vapour than a colder one, so if Reading has become warmer (and slightly wetter) has this been reflected in wetter days and heavier rainfall?

  • Of the 12 calendar months, 8 have seem the wettest day become wetter between 1971-2020 and 1991-2020, with March seeing no change in the fall on the wettest day.
  • Over the year as a whole, the expected rainfall on the wettest day has increased from 33.4 mm to 34.6 mm.
  • The number of days with 10 mm or more of rainfall has shown a slight increase between 1971-2000 and 1991-2020 in each season, with the exception of spring.

Month Wettest day on average (mm) Season Number of days each season with 10 mm or more rainfall

1971-2000 1991-2020 1971-2000 1991-2020
Jan 12.1 13.4 Spring 2.9 2.7
Feb 9.1 10.5 Summer 3.6 4.0
Mar 10.6 10.6 Autumn 4.8 5.4
Apr 12.4 12.7 Winter 3.6 4.2
May 12.9 11.9
June 14.7 15.9
July 15.9 17.3
Aug 17.9 17.1
Sept 19.5 17.9
Oct 17.8 18.7
Nov 14.9 16.2
Dec 14.4 15.0
Year 33.4 34.6 14.8 16.3

Snowfall and the length of summer

While precipitation amounts have increased in recent years, the number of days with snow falling and lying have both declined:

  • The average annual count of days with sleet or snow observed to fall has dropped from 11.4 days in 1971-2000 to 9.9 days in 1991-2020.
  • The average annual count of days with snow lying (and covering at least half the ground) has dropped from 5.6 days in 1971-2000 to 4.2 days in 1991-2020.
  • On average nowadays, both snow and air frost now tend to start occurring later in the year and stop occurring earlier in spring - the annual summer-time frost/snow-free period has lengthened.

Period First and last dates with air frost First and last dates with sleet/snow falling
1971-2000 6 November - 20 April 12 December - 6 April
1991-2020 5 November - 13 April 22 December - 22 March

Sunshine and fog

Sunshine has been measured using a Campbell-Stokes sunshine recorder. Since 1971 this has been located in several locations, e.g. on the roof of the Department of Chemistry, in the observatory enclosure at a height of about 2 metres, and latterly on the roof the Department of Meteorology. Each site has its own characteristics, and any sunshine trends need to bear this in mind.

  • Annually-averaged sunshine totals have increased from 1521 hours in 1971-2000, to 1567 hours in 1991-2020. Such an increase may simply be due to site changes.
  • Of the seven sunniest years since sunshine records began in 1956, four have occurred since 2003 - in order of increasing sunshine - in 2019, 2003, 2018 and 2020 (when 1892 hours were recorded); the sunniest year was 1959 with 1917.8 hours.
  • Four of the seven of the sunniest months in that same period have occurred since 2006 - including the sunniest of any month (May 2020 with 345 hours) and the sunniest July in 2018, while 2020 also produced the sunniest April in the record.
  • These site changes might be the reason why sunshine amounts have decreased a little in winter (nearby trees are known to prevent sunshine being recorded currently around dawn in winter), while the largest increases in sunshine have occurred in spring - and especially in April.
  • The presence of fog is measured at 0900 UTC and, as a result, is most likely to be observed in winter when this time is close to sunrise - in summer the warming of the air since sun rise will have tended to help any fog evaporate by lowering the relative humidity. The average annual number of days with fog has decreased from 15.7 days in 1971-2000 to 12.9 days in 1991-2020 - possibly reflecting slightly cleaner air conditions nowadays. (In 1952 many parts of south-east England experienced smog, which led to clean air acts that sought to reduce pollution levels.)

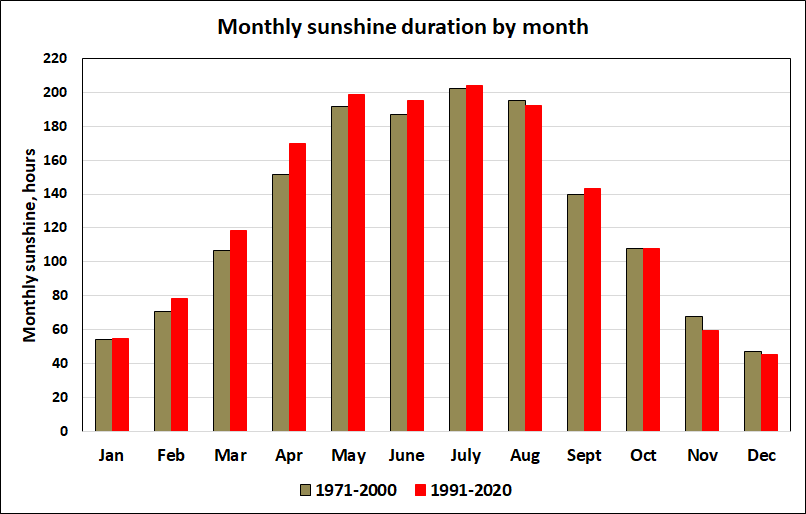
Figure 5. Sunshine changes by month, 1971-2000 to 1991-2020.

Instrument of the month

The hook gauge for measuring evaporation

The hook gauge is one instrument used to determine daily evaporation rates at the University of Reading's weather observatory.

A brass hook gauge is placed inside a ‘still well' fixed to the side of a large water tank that is open to the air. The still well provides a small area of water surface free from ripples. It has an opening in the base to equalise water levels inside and out. The height of the hook is adjusted until its point just breaks the surface of the water. The gauge has a micrometer head to permit very fine adjustments to be made.

The difference in the water levels (due allowance being made for any precipitation that has fallen) between two consecutive days is noted at 0900 UTC - this is the daily evaporation amount (measured in millimetres), and is credited to the earlier of the two days.

If the water surface is frozen, a note is made in the records to this effect, and the evaporation over several days will be recorded once the ice melts.
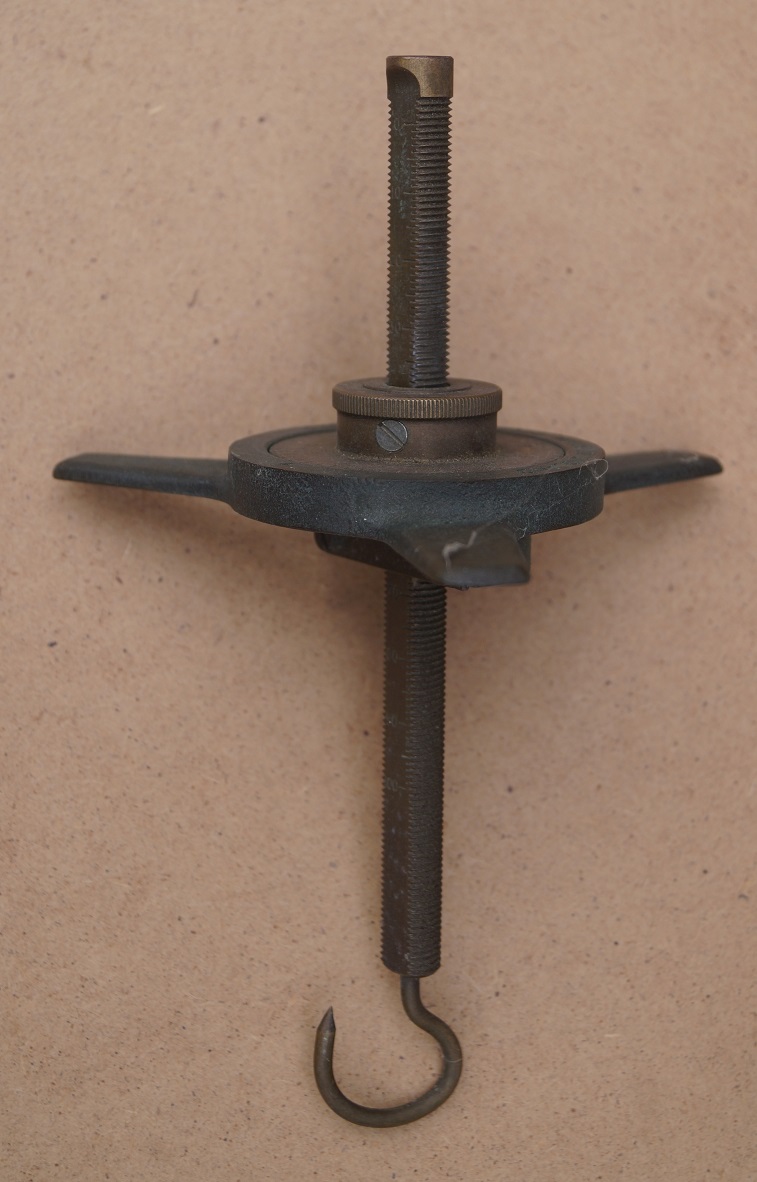
The hook gauge.

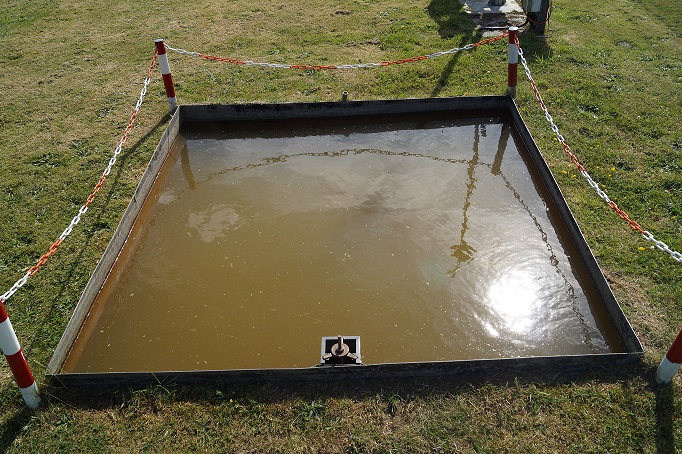
The evaporation tank with hook gauge in place.